Duke University researchers have created a tool that uses artificial learning, satellite images, and weather data to pinpoint hotspots of high air emissions on a city-by-city basis.
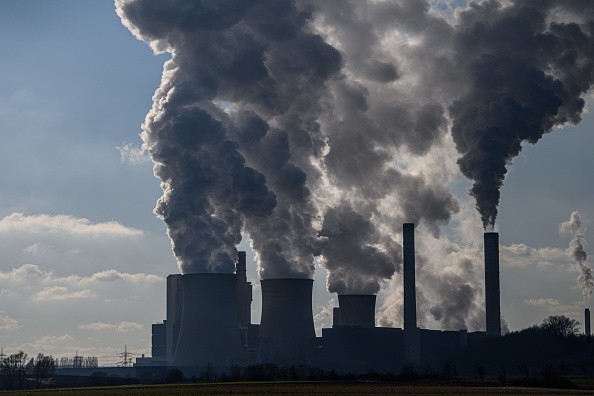
The method may help locate and reduce toxic aerosol sources, researching the impact of air pollution on human health, and making more educated and socially fair public policy decisions.
Looking for Ways to Calculate Air Pollution Spread
"Previously, researchers seeking to calculate the spread of air pollution in a region will want to use the small number of available detectors or drive sensors across the city in cars," said Mike Bergin, a Duke professor of civil and environmental engineering. "However, establishing sensor networks takes time and money, and the only thing that moving a sensor around shows you is that roads are major polluters. Finding geographic hotspots of air pollution using satellite imagery is extremely useful."
Looking for PM2.5
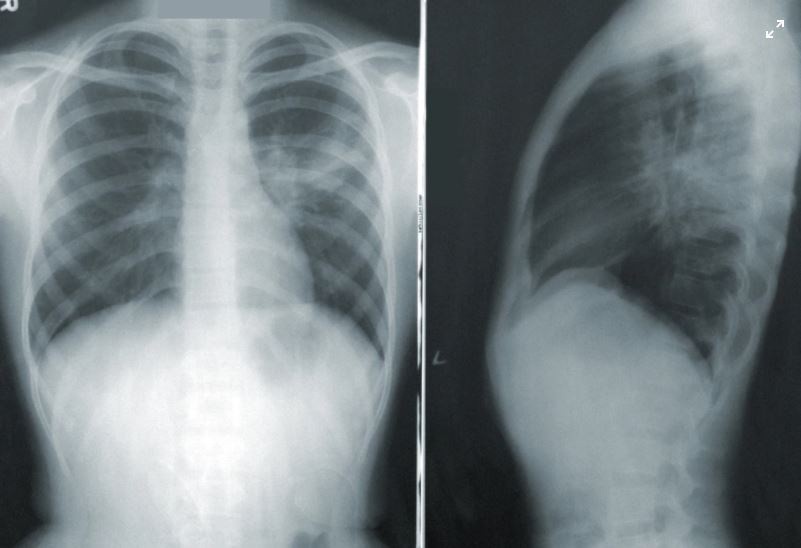
Bergin and his collaborators are particularly interested in PM2.5, which are microscopic airborne particles. Because of their capacity to penetrate deep through the lungs, these particles, which have a diameter of less than 2.5 micrometers-roughly three percent of the diameter of a human hair-have been found to have a dramatic impact on human wellbeing.
PM2.5 was ranked seventh on the Global Burden of Disease study's list of mortality risk factors in 2015. According to the report, PM2.5 was responsible for 4.2 million deaths and 103.1 million years of life lost or living with disabilities in a single year. According to a new report from Harvard University's T.H. Chan School of Public Health, regions with higher PM2.5 levels have higher COVID-19 mortality rates.
However, the Harvard researchers were only able to view PM2.5 data on a county-by-county basis within the US. County-level emissions numbers are helpful as a starting point, but they can't differentiate between a suburb next to a coal-fired power station and one next to a park 30 miles upwind. Many countries outside of the Western world do not have air quality control at that stage.
"Ground stations are costly to install and operate," Bergin said, "but even big cities are unlikely to have more than a few." "So, while they may have a general understanding of the volume of PM2.5 in the air, they fall well short of providing a true distribution for people living in various parts of the city."
The researchers previously demonstrated that satellite imaging, weather data, and machine learning could provide PM2.5 measurements on a small scale in previous work with doctoral student Tongshu Zheng and colleague David Carlson, assistant professor of civil and environmental engineering at Duke.
Finding Pollution Hotspots
The team has developed their methodology and trained the algorithm to automatically detect hotspots and cool spots of air pollution with a resolution of 300 meters-roughly the length of a New York City block-based on their previous work and focused on Beijing.
The progress was achieved by using a method known as residual learning. The algorithm begins by estimating PM2.5 levels solely based on weather data. The disparity between these projections and real PM2.5 amounts is then measured, and the system learns to use satellite imagery to improve its forecasts.
"When weather forecasts are made first, and then satellite data is applied later to fine-tune them, the algorithm can fully use the knowledge in satellite imagery," Zheng said.
The researchers then used an algorithm that was originally developed to alter uneven light in an image to detect regions with high and low air pollution levels. The process, known as local contrast normalization, basically searches for city-block-sized pixels with higher or lower PM2.5 levels than those in their area.
"Being able to identify a particular neighborhood that continues to remain higher or lower than anywhere else is a huge plus, and it will help us address concerns about health inequalities and environmental justice," Carlson said.
Practical Use
Although the same methods that the algorithm teaches itself do not move from city to city, the algorithm could quickly learn new strategies in various places. And, while weather and pollution trends in cities may change over time, the algorithm should be able to keep up with them. Furthermore, the researchers point out that the number of air quality sensors will only grow in the coming years, so they think their solution will only improve over time.
"I believe we'll be able to identify constructed environments in these photographs that are similar to the hot and cold spots," Bergin said. "The next step will be to investigate how these hotspots are linked to social status and hospital admission rates after long-term exposures. This strategy has the potential to lead us a long way, and the applications are endless."
For more news about Environmental Action, don't forget to follow Nature World News!
© 2026 NatureWorldNews.com All rights reserved. Do not reproduce without permission.


